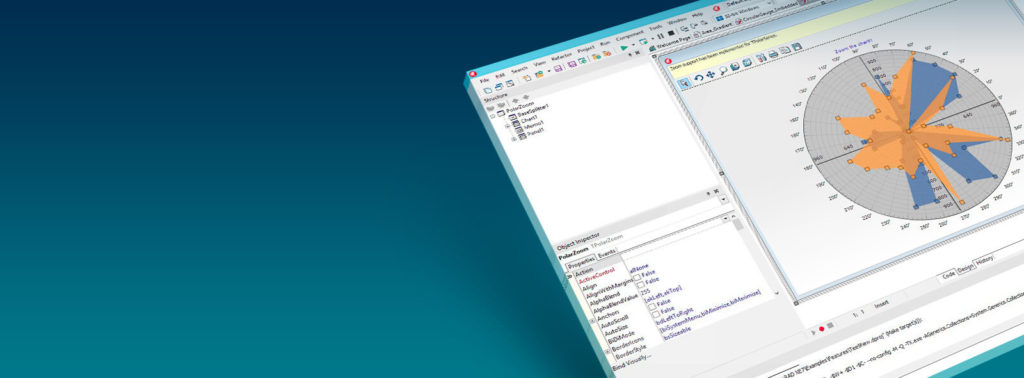
Delphi’s versatility and robustness make it an ideal choice for building various applications. One area where Delphi truly shines is in creating reports and charts using its specialized Data Access Components. These components offer a seamless connection between data sources and reporting tools, enabling developers to present data visually. Delphi Data Access Components provide tools that facilitate database connectivity and data access within applications. These elements serve as connectors between the application and the data, enabling developers to concentrate on generating meaningful reports without being overwhelmed by intricate data access codes.
Key features of delphi data access components
- Dataset components – DACs provide dataset components, such as TTable, TQuery, and TStoredProc, which enable the retrieval and manipulation of data from connected data sources. These components offer a familiar interface for working with data, resembling the standard SQL querying methods.
- Reporting tools integration – Delphi DACs seamlessly integrate with various reporting tools, like FastReport, Rave Reports, and QuickReport. This integration enables developers to design visually stunning and dynamic reports that can be exported in multiple formats, such as PDF, Excel, or HTML.
- Charting components – In addition to reporting tools, DACs also offer charting components like TeeChart, enabling developers to create interactive and informative charts, graphs, and dashboards based on the retrieved data.
Building reports with delphi DACs
Establish a connection to the data source using the appropriate database components for Delphi and specify connection parameters like database name, username, and password. Choose the dataset component that best suits your data retrieval needs. Utilize the selected dataset component to fetch the required data from the data source. Integrate the dataset component with your preferred reporting tool to design the report layout. Add data fields, headers, footers, and other elements to organize the data effectively. Once the report design is complete, use the reporting tool’s export functionality to save the report in the desired format.
Tips for building effective reports & charts
Before starting the report and chart-building process, thoroughly understand the data requirements of your application. Identify the key data points and metrics that need to be presented in the report or chart to ensure that the final output is relevant and valuable. Efficiently retrieve data from the data source by utilizing appropriate query optimization techniques. Avoid fetching unnecessary data and implement filters or parameters to narrow down the dataset, especially when dealing with large datasets.
Delphi offers integration with various reporting tools, each with its strengths and features. Select the reporting tool that aligns best with your project’s needs and your familiarity with the tool. Take into consideration factors like report design flexibility, export formats, and charting capabilities. Design the report layout in a clear and organized manner. Group related data together, use headings and subheadings to provide context and employ consistent formatting throughout the report. A well-structured report enhances readability and comprehension. Thoroughly test the generated reports and charts with different data scenarios to ensure accuracy and reliability. Verify that the data presented in the report matches the data in the source database. Address any discrepancies or issues that arise during testing.


